Case Study
Industrial Data & Production Analytics
Building a complete data path from PLC-level production information to operator visibility, production analytics and engineering action.
Machine states, process variables, stoppages and weighing data were brought into a common architecture and used to identify production losses, investigate root causes and guide practical improvements.
Context
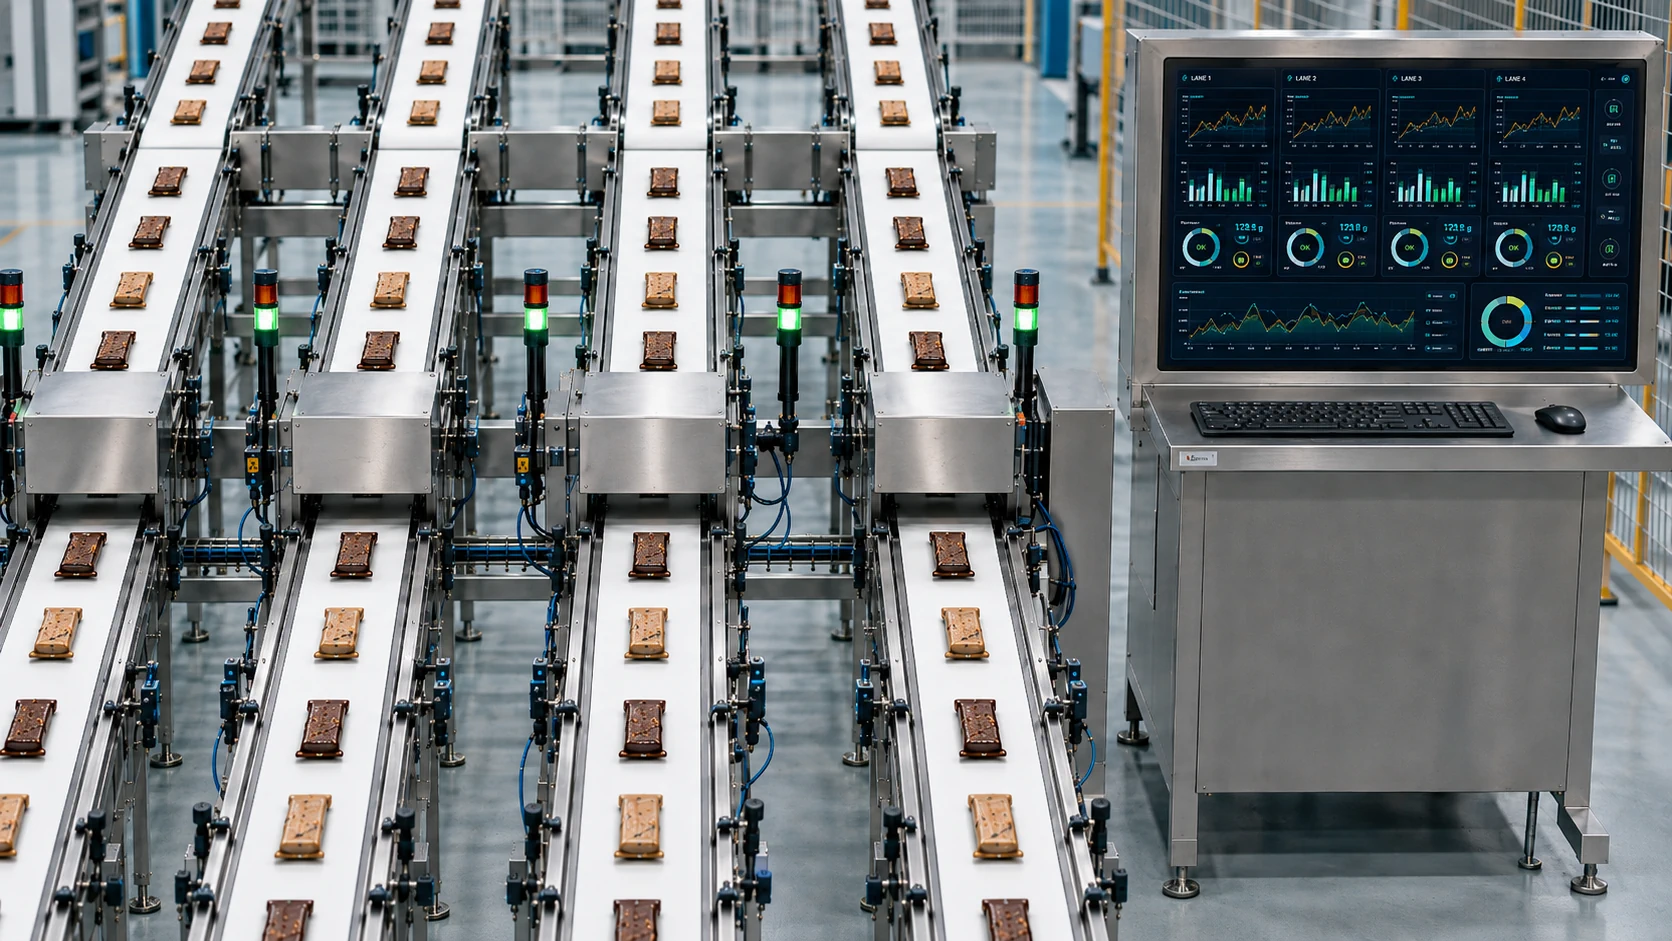
A production line was experiencing excessive product giveaway and variation around target product weight. Multiple weighing points and machine signals were available, but the information was not yet structured and connected in a way that could explain when and why the process was drifting.
The engineering objective was to create the required production data, connect it into a common architecture, make the process visible to operators and engineering teams, and use the collected information to identify the main sources of weight variation and production loss.
Engineering Challenge
The main challenge was not simply collecting more data, but turning information from different parts of the production process into a structure that could explain product-weight behavior.
Key challenges included:
- creating the required PLC-side production data,
- publishing machine information through OPC,
- collecting data from multiple production and weighing points,
- combining machine and process information with product-weight measurements,
- creating a local architecture suitable for continuous production use,
- presenting relevant process information to operators close to the machine,
- distinguishing normal process variation from recurring production losses,
- identifying relationships between machine stoppages, process behavior and product weight,
- converting analytical findings into practical changes on the production line.
The project therefore required automation, industrial connectivity, data engineering, visualization and production-process understanding to work together.
My Role
My role covered the data architecture, industrial integration, data-application development and production analysis.
Responsibilities included:
- defining the data-collection architecture,
- developing the required PLC-side data structures and OPC publication,
- connecting weighing and machine information into a common data flow,
- developing data-acquisition and visualization applications,
- storing and organizing production data for analysis,
- developing operator-facing dashboards close to the production process,
- performing offline exploratory data analysis,
- comparing machine states, stoppages and process measurements with product-weight behavior,
- identifying recurring sources of production loss,
- translating analytical findings into practical machine and process improvements,
- validating the impact of changes during production.
Engineering Approach
The engineering approach focused on building a complete data path from the machine level to operator visibility and production analysis.
-
Define the information needs
Determine which machine states, process variables, weighing results and production events were needed to explain product-weight behavior.
-
Develop the PLC-side data structures
Revise PLC programs so that the required production information could be generated in a structured form and published through OPC.
-
Build the data-collection architecture
Bring machine data and weighing information into a common data flow and transfer it to the local data infrastructure.
-
Store and organize the data
Store production information in a structured form suitable for both continuous monitoring and offline analysis.
-
Develop operator-facing visualization
Develop a dashboard close to the process so that operators could see relevant weight and process behavior during production.
-
Perform exploratory production analysis
Analyze historical data to compare product weight with machine states, stoppages and process behavior.
-
Translate findings into machine improvements
Convert analytical findings into practical changes in machine logic and production behavior.
-
Validate the improvement in production
Evaluate the impact of the changes using subsequent production data and observed process behavior.
The objective was not to create a reporting system for its own sake, but to build a feedback loop in which machine data could lead to operational understanding and then to measurable process improvement.
System Architecture
Machine & Process Layer
PLC/PAC controllers, machine states, alarms, production signals and process measurements
Weighing Layer
End-of-line checkweighers and process weighing points providing product-weight information
PLC Data Publication Layer
PLC-side data structures developed to expose required production information through OPC
Industrial Communication Layer
OPC DA / OPC UA-based data transfer between machine systems and the local data infrastructure
Local Data Layer
Industrial IPC, data-acquisition applications and SQL-based storage
Operator Visualization Layer
Dashboard providing real-time or near-real-time visibility into weight and process behavior
Analytics Layer
Offline exploratory analysis combining production events, machine states, stoppages and weight data
Improvement Loop
Analytical findings → machine / process change → production validation → new data
Key Technologies & Methods
The project combined machine-level data generation, industrial communication, data acquisition, database storage, operator visualization and production analytics within one integrated engineering workflow.
The engineering value of the technology stack came from connecting the entire chain from PLC logic and machine behavior to production analysis and engineering action.
Outcome / Engineering Value
The project was initiated around a clear production-cost problem: average product weight was consistently running above its nominal target. This excess weight represented unnecessary product giveaway and increased the consumption of high-cost raw materials.
Instead of treating the issue only as a weighing or operator-setting problem, machine states, process measurements, stoppages and weight data were collected and analyzed together. This made it possible to understand how process behavior and machine disturbances contributed to weight variation and material loss.
The analysis identified recurring production conditions that were affecting process stability and product-weight consistency. These findings were translated into practical improvements in machine behavior, production monitoring and operator visibility, and their impact was evaluated using subsequent production data.
At the beginning of the analysis, average product weight was approximately 14% above the nominal target. During the improvement period, this deviation was reduced to approximately 4% above nominal. As a result, excess product giveaway above the nominal target was reduced by approximately 70%, while production requirements were maintained.
The main engineering value therefore went beyond creating dashboards or collecting production data. The project established a practical improvement loop in which machine data was used to identify production losses, understand their causes and guide engineering and operational action.
Machine Data → Production Insight → Root Cause → Engineering Action → Production Validation
What This Demonstrates
- Ability to generate usable production data directly from PLC/PAC systems
- Industrial data architecture from machine level to analytics
- OPC-based integration across production systems
- Development of data-acquisition, visualization and analysis applications for industrial environments
- SQL-based production-data storage and organization
- Use of Python and Jupyter for real production analysis
- Ability to connect machine behavior, stoppages, process variables and quality-related data
- Root-cause investigation based on production evidence rather than isolated observations
- Translation of analytical findings into practical engineering actions
- Validation of improvements using subsequent production data
- Ability to connect automation engineering with measurable production improvement